Pharma's not so stingy with R&D after all
Want to get smarter about biotech clinical trials, R&D strategy, and financial modeling? Join the thousands of biopharma execs and professionals who subscribe to our free email newsletter. Read a sample issue, and then sign up here.
[This post originally appeared on Forbes.com on May 14, 2017.]
Many pharma critics argue that drug companies skimp on research while earning outsize revenues–but a new analysis my colleague and I just published tells a more nuanced story.
First, some background. Journalists and academics often point to the fraction of revenues that drug companies spend on research versus “sales, general and administrative” (SG&A) expenses as evidence that pharma underfunds research. But as Derek Lowe (here, here) and others have noted, these analyses provide zero insight into whether spending in each category is too high, too low or just right. Just as households need to spend money on food and utilities, pharma companies need to pay for both SG&A (which includes not just commercial expenses, but also corporate infrastructure) and R&D, and it’s impossible to say a priori which should be a larger fraction of top-line revenues.
Instead, it's more pertinent to ask about how the growth rates of R&D, SG&A and revenue are related. I think many critics and lay readers would reflexively assume that even when adjusted for inflation, pharma's revenues have increased year over year, while R&D spending may have stayed constant or even declined.
But that’s not the case, as my Pharmagellan colleague Richa Dixit and I found in our new paper in Nature Reviews Drug Discovery (contact me for a PDF). We examined financial data from 2005 to 2015 for the 10 largest R&D spenders among public big pharma. Looking at the group as a whole, we found the inflation-adjusted compound annual growth rate (CAGR) for R&D (+1.76%) over that period exceeded that of both revenue (-0.01%) and SG&A (-1.12%). And this pattern of the change in R&D spending growth outpacing those of both revenues and SG&A also held true for most of the individual companies. (See note at the end for some additional analysis.)

R&D spending, revenue and selling, general and administrative (SG&A) expenses for each company were converted into US$ as needed, inflation-adjusted (using US inflation rates) and normalized to 2005 values. The compound annual growth rate from 2005 to 2015 for each metric is shown in the colored boxes. (NRDD/Pharmagellan)
Another common belief among critics is that when times get tough in pharma, R&D is the first thing to get slashed–but in fact, that appears to be an oversimplification as well. We looked specifically at instances when a company’s revenue declined by more than 5% (inflation-adjusted) and asked how the drugmaker responded in the following year. Even in the face of steep revenue drops, R&D mostly either increased (9/20) or decreased by a lesser percentage than SG&A (5/20), suggesting that companies often strive to protect R&D even in the face of acute financial pressure.
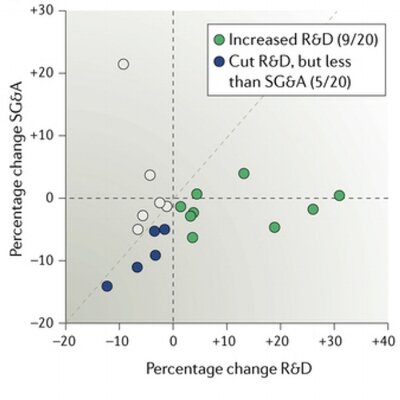
R&D and SG&A spending by companies in response to large revenue declines. Each data point is from a year in which revenues decreased by >5% compared with the previous year, and reflects the change in R&D and SG&A spending from that year to the subsequent year. All revenue, R&D and SG&A percentages reflect inflation adjustments. See original article for details. (NRDD/Pharmagellan)
Importantly, that last point counters not just a dominant narrative from pharma critics, but also one of the industry’s key arguments against price controls. Price hikes are a major driver of pharma revenue growth, and it’s hard to predict what might happen to the biopharma ecosystem if that growth were constrained. However, these data suggest that large drugmakers are generally committed to sustaining R&D, and many manage to grow research spending even in the face of both acute and longer-term revenue declines. In other words, pharma’s R&D spending may be more strategic than algorithmic, and the simple assumption that lower revenue growth would lead companies to invest less in drug research may not be entirely accurate.
Note: Instead of calculating CAGRs (which only depend on the starting and ending values in the series), one can look at the slopes of the best-fit lines for each 10-year data series, which yields slightly different numbers but essentially the same story; see table below. Using this approach, we found that the annual growth rate of R&D spending (+1.3%) still exceeds that of both revenue (+0.24%) and SG&A cost (-0.80%) for the total set of companies. The rate of growth in R&D exceeds that of SG&A in eight of the 10 individual firms, and it exceeds that of revenue in seven of 10. (For reference, in the published paper, R&D CAGR exceeded SG&A CAGR and revenue CAGR in 9/10 and 8/10 firms, respectively.)

Slopes of best-fit lines for inflation-adjusted and normalized R&D spending, SG&A costs and revenues, 2005-2015. See text and original paper for details.
Thanks to Chris Franco (Takeda) and Scott Innis (Biogen) for input on drafts of the research cited here. Feel free to email me with questions or for a copy of the article.